


.svg)


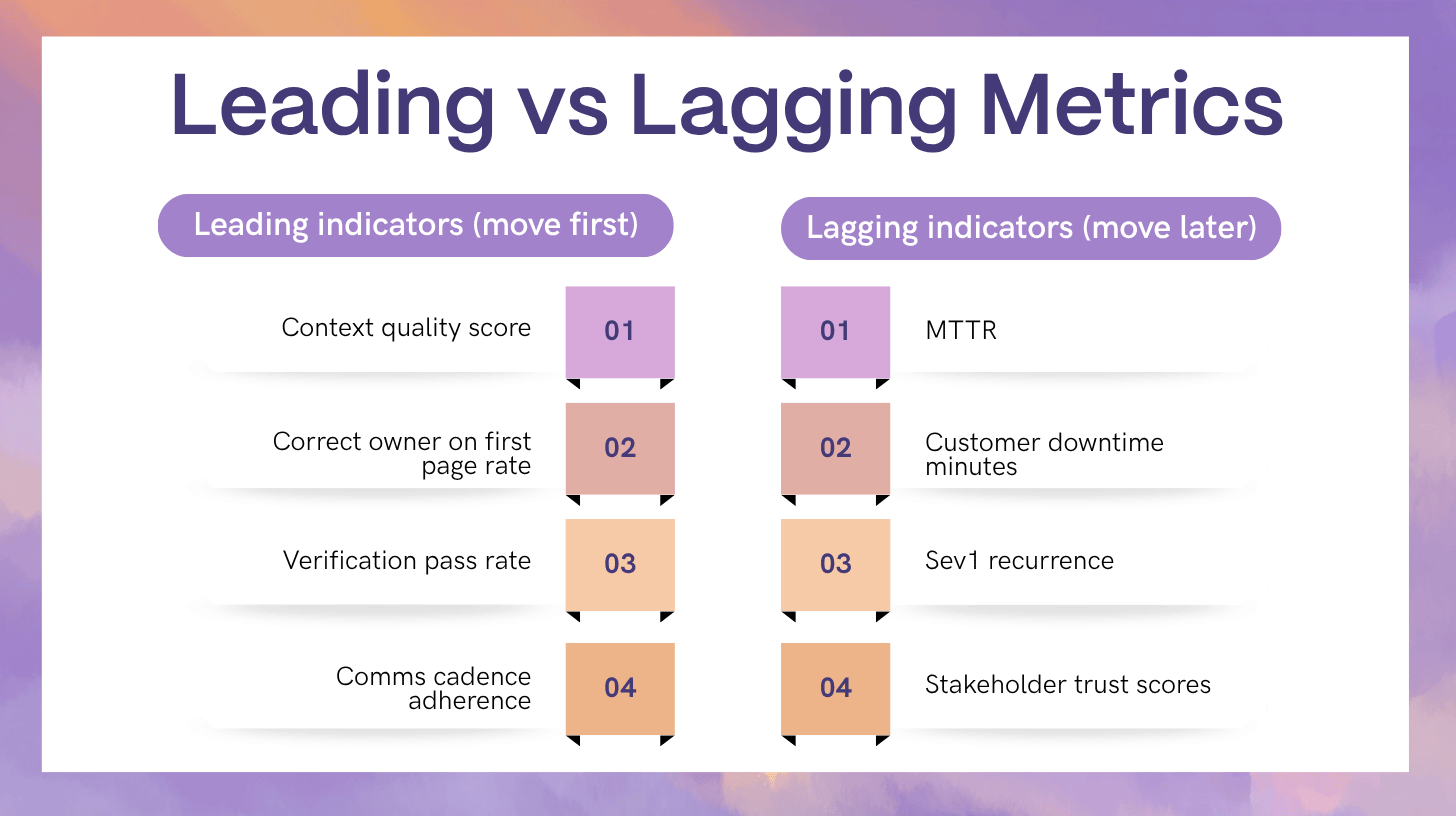
MTTR is a useful reliability signal, but it is a weak adoption metric for AI SRE. MTTR is noisy, severity-dependent, and easily skewed by one extreme incident. It also hides the real early wins AI SRE is built to produce: faster clarity, fewer misroutes, safer execution, and less operational overhead across engineering, support, and leadership.
AI SRE changes incident response by compressing the early phase where teams lose time: assembling context, aligning on what changed, finding owners, and deciding what is safe to try. If you measure only MTTR, you will miss most of the value until months later, and you will struggle to justify investments that are clearly improving responder experience and risk controls.
Measuring AI SRE impact requires a practical scorecard and defensible ROI models. The goal is not more dashboards. The goal is a measurement system that shows what is working, what is unsafe, and what to improve next.
Key Takeaways
- MTTR is a lagging indicator. AI SRE value shows up first in context quality, routing accuracy, and verification success.
- The best scorecards separate workflow quality, reliability outcomes, and business outcomes to avoid confusing activity with value.
- Safety metrics are part of ROI because prevented harm is real impact in production systems.
- A credible ROI model uses ranges, confidence ratings, and segmented incident classes rather than a single headline number.
1) A Practical Measurement Framework for AI SRE
AI SRE measurement works when every metric answers one question: what decision will we make if the number moves?
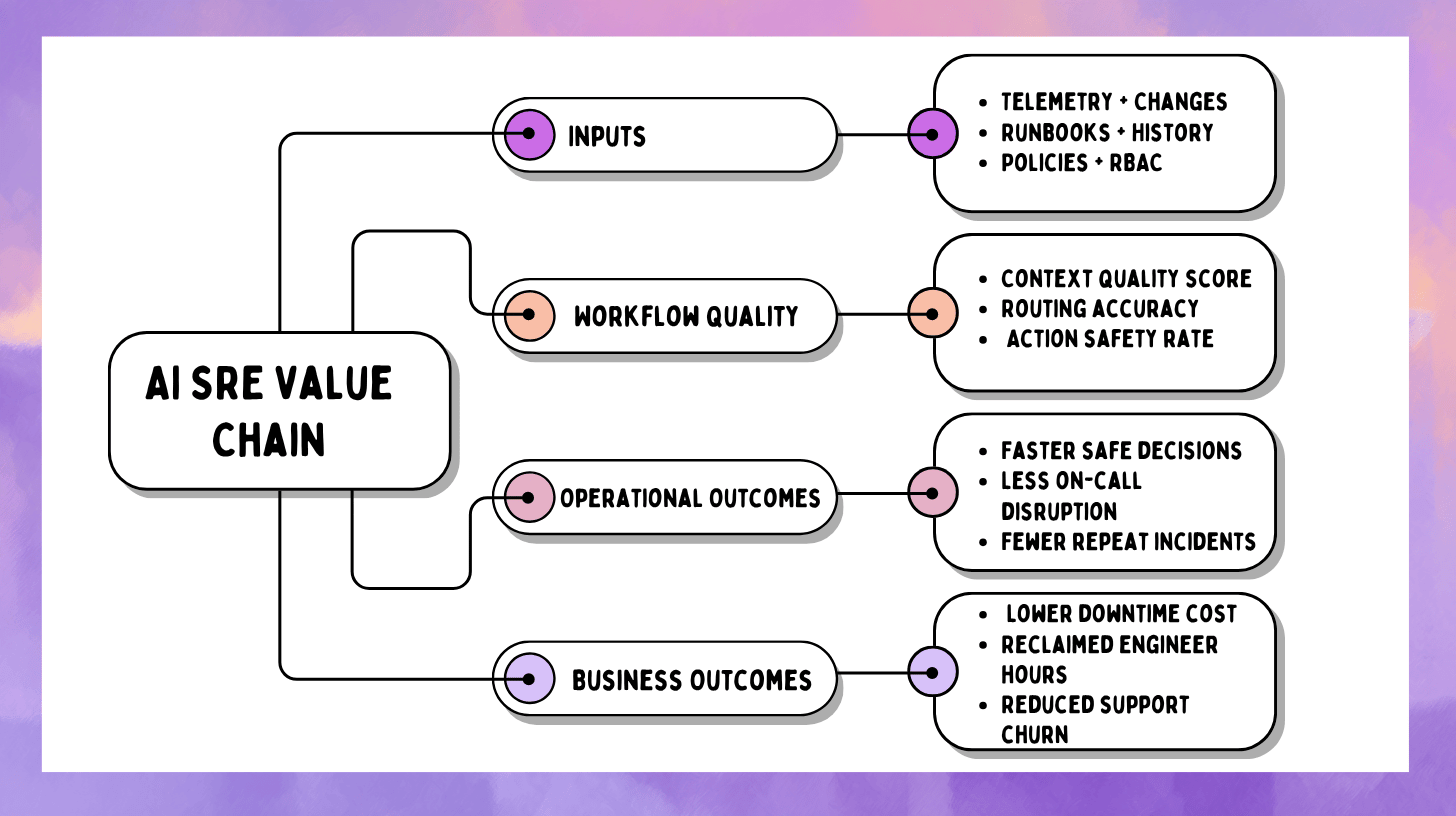
A clean way to structure the scorecard is three layers.
Layer A: Workflow quality metrics
These describe what responders experience during real incidents. They are leading indicators.
Examples:
- Context quality score
- Correct owner on first page rate
- Verification pass rate for approved actions
- Communications cadence adherence
Layer B: Reliability metrics
These describe what production experiences. They move slower.
Examples:
- MTTR by severity and incident class
- Error budget burn per incident class
- Recurrence rate for known failure modes
Layer C: Business metrics
These translate reliability into money, time, and risk.
Examples:
- Avoided downtime cost (range)
- Reclaimed engineering hours
- Reduced incident overhead across support and customer success
- Reduced compliance effort due to audit-ready records
The mistake is skipping Layer A and expecting Layer B to move quickly. In most organizations, workflow quality improves first. Reliability outcomes follow once the workflow improvements become consistent.
2) Build a Baseline That Does Not Lie
If your baseline is wrong, your ROI story collapses. The baseline needs to reflect the work AI SRE actually touches.
Segment by severity and incident class
Do not lump everything into one number. Segment at minimum by:
- Severity (Sev1, Sev2, Sev3)
- Incident class (deploy-related, dependency outage, capacity saturation, config regression, noisy alert storm)
- Service tier (critical revenue path vs internal tooling)
AI SRE often improves specific classes first, like deploy-related incidents where change context is rich and mitigations are reversible. If you blend those with rare infrastructure failures, the signal disappears.
Normalize for volume
If incident volume changes month to month, track rates:
- Incidents per 1,000 deploys
- Sev1 per month
- Repeat incident rate per service tier
Choose a baseline window that matches reality
Pick a pre-AI window long enough to include normal variability, then compare to a post-AI window with similar operational conditions. If there was a platform migration or a major org reorg, treat that as a boundary.
Define attribution rules early
Attribution does not need to be perfect, but it must be consistent. A practical approach:
- Direct impact metrics: measured only when AI SRE features were used (context packet generated, routing suggestion accepted, approved action executed).
- Indirect outcome metrics: tracked at the org level and interpreted with caution (MTTR, recurrence rate).
3) Leading Indicators That Predict Better Outcomes
These are the metrics that move first. They also tell you what to fix.
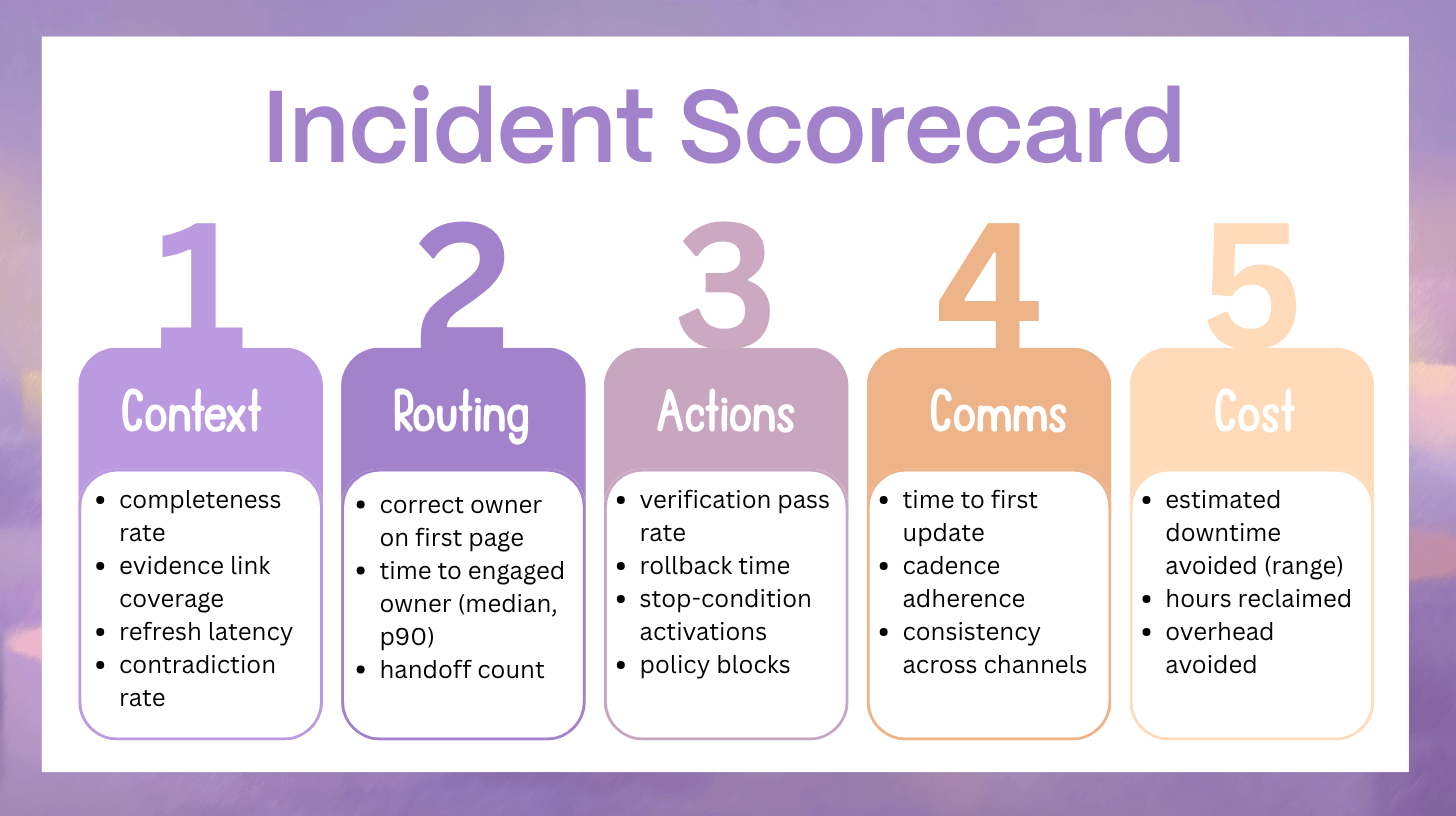
3.1 Context Quality Metrics
Context completeness rate
How often the incident context packet contains the required fields for that service tier.
Define required fields per tier, for example:
- Suspected service boundary
- Impacted SLO or user journey
- Recent changes in blast radius (deploys, flags, configs)
- Top anomalies with time window
- Likely owner and escalation policy
Evidence link coverage
Percentage of claims that include a link or reference to an artifact: metric window, log cluster, trace exemplar, deploy event, config diff, runbook step.
This metric protects trust. Fluent summaries without evidence quickly become ignored.
Context refresh latency
How quickly the context packet updates after new evidence arrives, such as a new deploy event or a sharp metric shift.
If refresh latency is slow, responders stop relying on the system and go back to manual hunting.
Contradiction rate
How often the incident narrative requires a major correction after being shared internally.
A rising contradiction rate usually means:
- stale ownership data
- missing change context
- weak correlation logic
- inconsistent time windows across tools
4) Routing Accuracy and Coordination Efficiency
AI SRE ROI often comes from fewer misroutes and less coordination churn, even before MTTR changes.
4.1 Correct owner on first page rate
The percentage of incidents where the first page reaches the owning team, not a guess.
This metric improves when service catalogs and ownership boundaries are treated as a product, not a spreadsheet.
4.2 Time to engaged owner
Time from detection to acknowledgement by the correct owning team.
Track median and p90. The p90 matters because late ownership is what creates long, chaotic incidents.
4.3 Handoff count
The number of team transfers before ownership stabilizes.
High handoff count is not just slow. It is expensive and cognitively draining.
4.4 Duplicate effort ratio
A proxy for parallel investigations that overlap.
A simple way to estimate:
- Count repeated queries and repeated checks across responders
- Count duplicate dashboards opened or identical log searches run
You do not need perfect measurement. You need a trend.
5) Action Safety and Control Metrics
AI SRE is judged on safety as much as speed. If safety is not measurable, governance teams will treat AI as risk.
5.1 Verification pass rate
Percentage of approved actions that improve the defined success signals.
A “pass” must be defined before the action runs, for example:
- error rate drops below threshold for N minutes
- latency returns within SLO band
- saturation metric decreases with no downstream regressions
This metric keeps the system honest because “action taken” is not value unless it measurably improves conditions.
5.2 Rollback time
Time from decision to revert to verified recovery.
Fast rollback is a sign of mature control rails and strong observability. Slow rollback means actions are not truly reversible in practice.
5.3 Stop-condition activation rate
How often the system halts an action sequence because harm signals are rising.
This is a positive metric when interpreted correctly. A stop condition that prevents blast radius growth is value.
5.4 Policy block rate
How often guardrails prevent an unsafe action attempt.
Also track why blocks occurred:
- missing preconditions
- insufficient permissions
- action not allowlisted
- verification signals undefined
Blocks are not failures. They are signals that your system is enforcing control.
6) Communications Metrics That Business Stakeholders Notice
Communications quality is measurable. It is also highly visible.
6.1 Time to first update
Time from incident start to first internal stakeholder update.
This does not mean external updates. It means a consistent internal signal to reduce confusion.
6.2 Cadence adherence
When teams promise “next update in 15 minutes,” do they deliver?
Measure:
- percentage of updates delivered within a tolerance window
- average delay from promised time
Cadence adherence reduces escalation noise and leadership interruptions.
6.3 Consistency rate
How often internal messages disagree with each other.
A practical way to measure:
- compare the structured incident state fields that messages are generated from
- count corrections required due to incorrect impact or scope statements
6.4 Rework rate for drafts
How often drafts require major edits because they are missing key facts or include inaccurate claims.
Rework rate is a strong indicator of whether your AI outputs are grounded and policy-aware.
7) Reliability Outcomes Beyond MTTR
Once workflow quality improves consistently, these outcomes tend to move.
7.1 Severity distribution shift
If AI SRE improves early intervention and safer mitigations, you may see:
- fewer Sev1 outcomes for the same class of failures
- faster containment before impact spreads
Track severity by incident class to avoid misleading conclusions.
7.2 Residual degradation time
Time from “incident resolved” to “system back to steady-state.”
Many teams close incidents after partial recovery. If AI SRE improves verification discipline, residual degradation time should shrink.
7.3 Repeat incident rate
Repeat incidents are expensive and demoralizing. Track:
- recurrence by incident class
- time between repeats
- percentage of repeats with the same change trigger patterns
This metric improves when learning artifacts are captured consistently and prevention work is prioritized.
8) ROI Models That Finance Will Accept
ROI fails when it is hand-wavy. ROI works when it is segmented, ranged, and confidence-scored.
The three ROI buckets
- Avoided downtime cost
- Reclaimed engineering time and reduced toil
- Reduced incident overhead across the organization
These buckets are additive, but you should report them separately so the story stays credible.
8.1 Downtime Cost Avoidance Model
A simple, defensible model uses ranges.
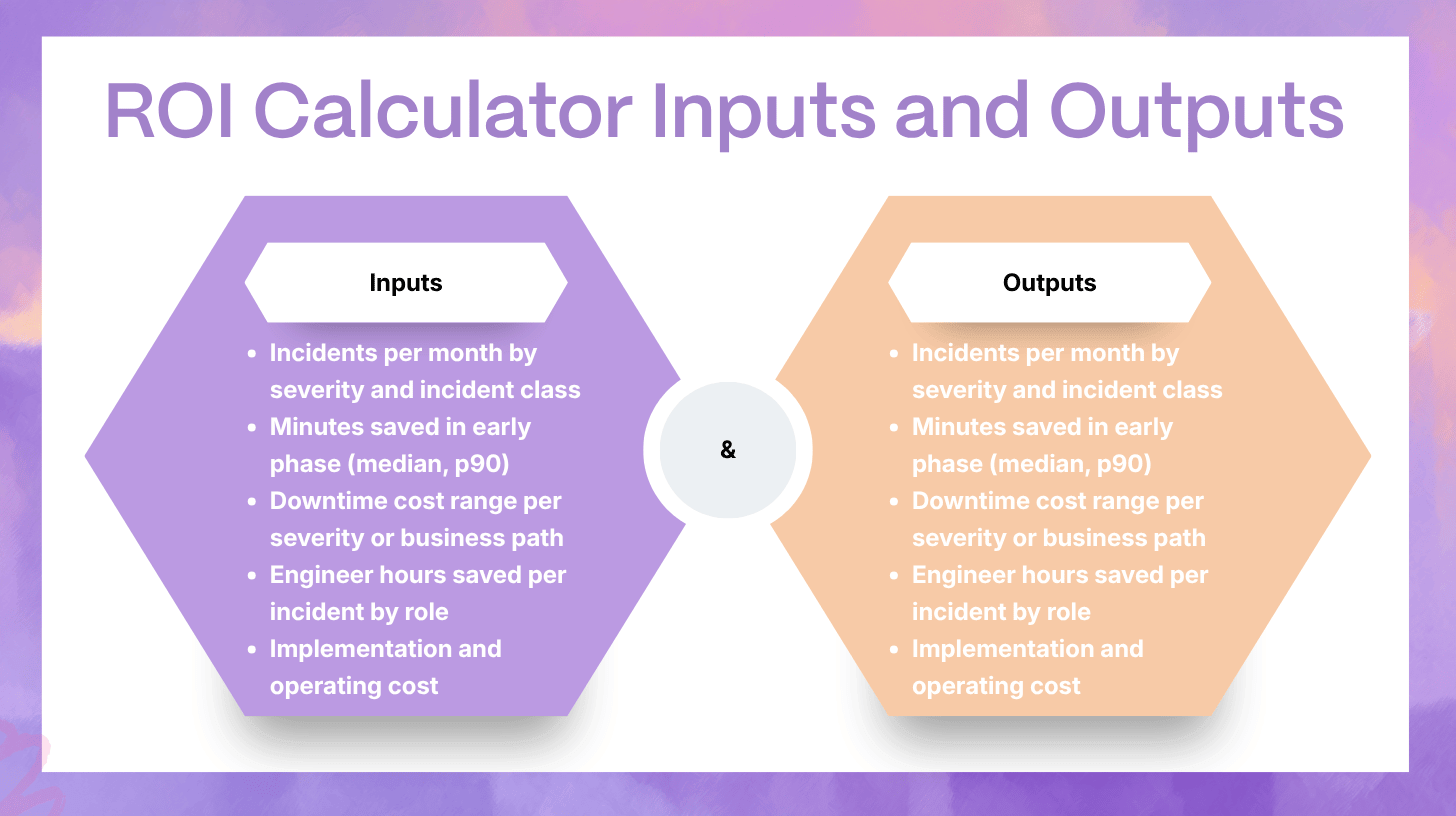
Step 1: Choose a cost range per minute by severity or business path
Examples of cost components:
- lost revenue and conversion
- SLA penalties
- churn risk and refunds
- support load spikes
- brand impact (often reported qualitatively)
Do not claim precision you do not have. Use a low and high estimate.
Step 2: Estimate minutes avoided
Minutes avoided can come from:
- reduced time to engaged owner
- reduced time to validated mitigation
- fewer wrong turns due to better context
Step 3: Calculate avoided cost
- Avoided cost (low) = minutes avoided × cost per minute (low)
- Avoided cost (high) = minutes avoided × cost per minute (high)
Report it as a range:
- “Estimated avoided downtime cost: $X to $Y per month”
This is far more believable than a single number.
8.2 Reclaimed Engineer Time and Toil Model
This ROI bucket is often easier to prove than downtime cost because it is closer to observable work.
Define the roles and time sinks
Common roles:
- primary responder
- incident commander
- comms lead
- scribe
- on-call secondary responders
Common time sinks:
- manual evidence gathering
- repeated context explanations
- drafting updates
- reconstructing timelines after the fact
- chasing ownership
Estimate hours saved per incident
Use one of these methods:
- tagging-based: responders tag tasks as “AI-assisted” and record time saved
- sampling: measure a sample set of incidents deeply and apply averages by class
- workflow events: infer time saved when context packets, drafts, and timelines are generated automatically
Translate into cost or capacity
- Hours reclaimed × loaded hourly cost = reclaimed cost
- Or report capacity regained and how it was redeployed:
- more prevention work shipped
- backlog burn-down
- reduced on-call fatigue and attrition risk
Finance teams often accept capacity arguments when the measurement is consistent.
8.3 Reduced Incident Overhead Model
Incidents consume time outside engineering.
Measure:
- support and customer success hours spent per Sev incident
- leadership interruptions and war-room participation time
- number of stakeholder escalations caused by missing updates
When comms become predictable and consistent, overhead drops. This is real ROI that rarely shows up in MTTR.
8.4 Risk Reduction as ROI
Risk reduction is measurable when you track near-misses and prevented harm.
Examples:
- policy blocks prevented a high-impact change without prerequisites
- stop conditions halted a rollout when errors increased
- rollback executed quickly before customer impact spread
Report:
- count of prevented unsafe actions
- severity of prevented actions
- patterns in why the system refused to act
This is not just safety theater. It is operational value and governance alignment.
9) Measurement Implementation Without Creating More Toil
If measurement becomes another manual burden, it will be abandoned.
9.1 Instrumentation requirements
At minimum, ensure you can capture:
- incident timestamps (start, detection, mitigation, resolved)
- ownership and handoff events
- context packet generation events and completeness fields
- action proposals, approvals, execution events, and outcomes
- verification check outcomes and rollback events
- comms timestamps and approval gates
9.2 Dashboard design principles
- One executive scorecard: trends, ranges, confidence rating
- One SRE diagnostic view: drill-down by incident class and service tier
- Outlier-first: highlight p90 regressions and recurring failure modes
- Automated narrative: the scorecard should explain why a metric moved
9.3 Common pitfalls
- Measuring averages only and ignoring p90
- Mixing incident classes and claiming broad improvement
- Counting AI activity instead of workflow outcomes
- Reporting ROI without confidence ratings and segmentation
10) A 30-60-90 Day AI SRE Measurement Plan
This plan is measurement-focused so it does not overlap with an implementation rollout guide.
Days 0–30: Baseline and leading indicators
- Define incident classes and severity segmentation
- Establish context quality score and routing metrics
- Start tracking time to first update and cadence adherence
- Produce an ROI draft with ranges and a confidence rating
Days 31–60: Safety and governance metrics
- Track verification pass rate for approved actions
- Track rollback time, stop conditions, and policy blocks
- Publish a monthly scorecard that includes safety outcomes
Days 61–90: ROI hardening and forecasting
- Expand ROI by incident class, not just severity
- Add reclaimed time by role and overhead reduction estimates
- Identify the top two incident classes where better data and runbook hygiene will yield the next ROI jump
FAQ
What should we measure first if MTTR is too noisy?
Start with context quality score, correct owner on first page rate, and time to first update. These move early and predict downstream improvements.
How do we attribute improvements to AI SRE instead of unrelated changes?
Use direct impact metrics tied to usage events, then interpret lagging outcomes with segmentation. Compare incident classes where AI SRE is active against classes where it is not yet used.
How do we convert “minutes saved” into dollars without overclaiming?
Use a downtime cost range, not a single number. Pair it with a confidence rating based on data completeness and segmentation quality.
What metrics prove AI SRE is safe, not just fast?
Verification pass rate, rollback time, stop-condition activation rate, policy block rate, and audit completeness. If these are improving, you are building speed with control.
What does good ROI look like in the first 90 days?
Expect ROI to show up first as reclaimed responder time, fewer misroutes, better comms cadence, and fewer coordination hours. MTTR improvements typically follow after workflow quality becomes consistent.
Putting AI SRE Metrics Into Practice
AI SRE measurement succeeds when it reflects how incidents actually work. The strongest programs use a scorecard that tracks workflow quality first, then shows how those leading indicators translate into reliability outcomes and business outcomes over time. This is how you prove value without waiting for MTTR to tell the story months later.
A mature measurement approach is also a safety system. If you can show evidence coverage, verification outcomes, rollback speed, and policy enforcement, you can scale AI SRE with governance teams as partners, not blockers.
At Rootly, we help teams operationalize these metrics inside the incident workflow so measurement becomes a byproduct of response, not a reporting project. If you want a practical scorecard and ROI model tailored to your incident classes, tool stack, and approval model, book a demo and we will map your current state to a measurable adoption plan.