


.svg)


Modern engineering teams operate in an environment where uptime is currency, customer trust is fragile, and incident response receives more scrutiny than ever. Many organizations still rely on instinct, scattered anecdotes, or outdated dashboards, which leaves them without a clear understanding of how their on-call teams truly perform.
To achieve faster response times, reduce late-night interruptions, support healthier teams, and maintain predictable reliability, organizations need genuine visibility instead of raw data. When the right on-call metrics are tracked and understood, teams can pinpoint unstable services, uncover where responders face unnecessary friction, and identify process gaps that quietly slow down incident resolution. A clear view of on-call performance allows engineering organizations to move beyond reactive firefighting and operate with intentional, data-informed reliability.
Key Takeaways
- On-call metrics provide visibility into how teams respond under pressure, revealing patterns that help reduce noise, improve response times, and strengthen reliability.
- A complete on-call picture requires measuring people, systems, and processes together, not just counting alerts or tracking basic statistics.
- Reducing alert noise has the biggest impact on team health and reliability because false positives, repeated alerts, and unnecessary pages create fatigue and slow down response.
- Human-centric metrics such as interruptions per shift, after-hours pages, and recovery time help organizations protect responders from burnout and maintain a fair, sustainable rotation.
- High-maturity teams operationalize reliability through regular reviews, clear scorecards, automation, and unified tooling, allowing them to anticipate failures rather than react to them.
Why On-Call Metrics Matter More Than Ever
The pressure on engineering teams continues to rise. It is no longer enough to be reactive or simply answer the pager and fight fires as they appear. Customers expect uninterrupted availability, leadership requires accurate reliability forecasting, and engineers want an on-call system that supports them rather than exhausting them.
Tracking on-call metrics is not about gathering numbers. It is about revealing patterns, reducing cognitive load, preventing burnout, and ensuring services operate as intended. When teams focus on the metrics that truly matter, reliability becomes a deliberate outcome rather than an accident.
What Are On-Call Metrics and How Are They Different from Basic Alert Statistics
On-call metrics reveal how effectively a team responds when an issue demands immediate attention. They provide far more insight than a simple count of alerts or a list of noisy services. These metrics show how people perform under pressure, how systems behave during failure, and how well processes support the responders who keep operations stable.
A complete view of on-call performance typically examines three major dimensions.
1. People
This dimension focuses on the individuals carrying the pager and the human experience of responding to alerts. Key considerations include:
- How quickly alerts are acknowledged
- How many interruptions occur during a shift
- How often responders are woken up during off hours
- Whether workload is evenly distributed across the rotation
People-centered metrics highlight burnout risk, imbalance, and hidden friction that slows down response times.
2. Systems
This dimension evaluates the health of services, infrastructure, and monitoring tools. Useful patterns emerge when teams review:
- Alert sources and their reliability
- Frequency of failures across different services
- Severity classifications and whether they reflect real impact
- Recurring issues that point to fragile components
System-level metrics help identify unstable architecture, threshold misconfigurations, and sources of avoidable noise.
3. Processes
This dimension examines how well incident response workflows support the team. Important signals include:
- Escalation workflows and whether they route alerts to the right owner
- Accuracy and completeness of runbooks
- Quality of collaboration during incidents
- Smoothness of handoffs between individuals or teams
Strong processes reduce cognitive load, improve coordination, and create consistent resolution outcomes.
When all three dimensions are reviewed together, they reveal the true state of on call performance. Basic alert statistics might show how many pages fired in a day, but on call metrics explain whether the team responded quickly, whether action was required, how difficult incidents were to fix, and how responders were affected. This deeper understanding allows engineering organizations to improve reliability intentionally rather than relying on luck.
Core On-Call Performance Metrics (Your Non-Negotiables)
These performance indicators form the foundation of a reliable and healthy on call program. They reveal how quickly teams respond, how effectively they resolve issues, and whether the overall workload is manageable.
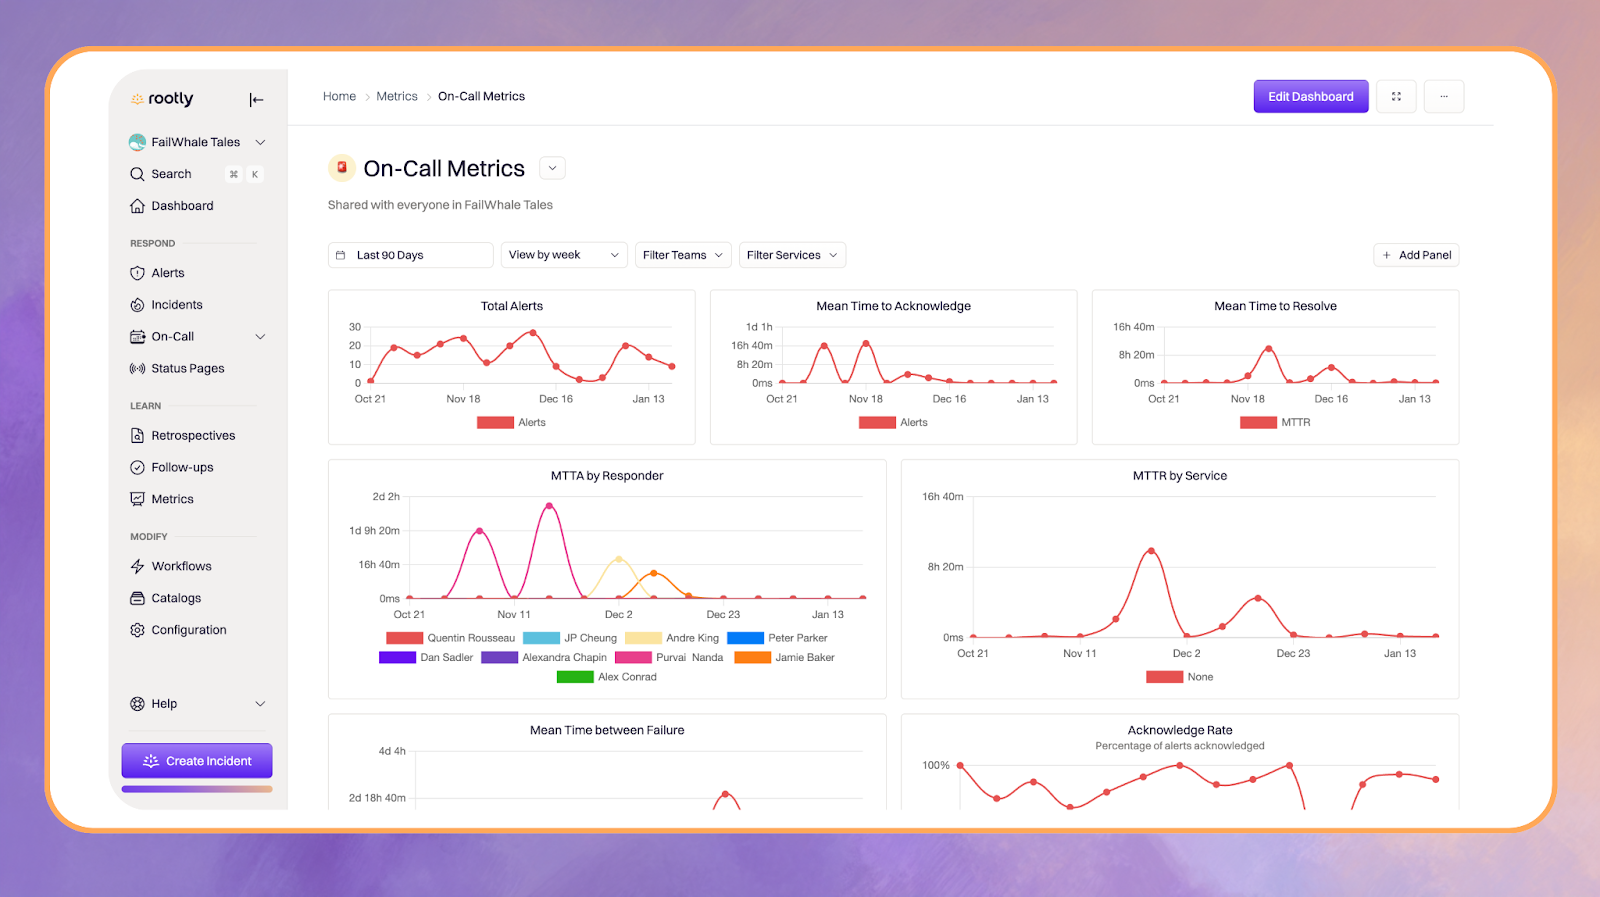
1. Mean Time to Acknowledge (MTTA)
MTTA measures how quickly responders confirm an alert. Slow acknowledgment usually signals unclear ownership, excessive noise, or an overloaded rotation. Consistent MTTA across all hours reflects a well-supported and well-structured on call program.
2. Mean Time to Resolve (MTTR)
MTTR shows how long it takes to fully mitigate an issue after acknowledgment. Large spikes often point to missing runbooks, complex services, slow deployment processes, or unclear escalation paths. Stable MTTR is one of the strongest indicators of operational maturity.
3. Alert Volume and Trend Velocity
Alert volume shows how many alerts fire, but trend velocity reveals how quickly patterns shift. Sudden increases may indicate regressions, new bugs, recurring failures, or broken monitoring. Volume explains what happened. Velocity shows where attention is needed.
4. Paging Frequency and Mean Time Between Failures (MTBF)
Paging frequency reflects how often responders are interrupted. MTBF shows how long systems run before another alert occurs. Frequent interruptions lead to fatigue, slower acknowledgment, and weaker decision making. Healthy teams monitor these closely to maintain sustainable workloads.
5. Acknowledge Rate and Escalation Rates
Acknowledge rate measures how often the primary responds. Escalation rate reflects how often alerts move to another person or team. High escalation or low acknowledgment often means responders are overloaded or routing rules are outdated. These metrics directly influence team morale and on call quality.
Advanced Analytics That Reveal Hidden Operational Problems
Once the core metrics are in place, deeper analytics help uncover the true sources of instability and operational pain.
Alerts by Source
This metric shows which monitoring tools create the most noise. High volumes often point to overly sensitive thresholds, misconfigured health checks, or outdated monitoring systems. A single noisy source can distort MTTA and MTTR by overwhelming responders with irrelevant signals.
Alerts by Service
Reviewing alerts at the service level reveals which parts of the architecture are fragile. Repeated failures, dependency chains that fall apart together, or services that degrade under load help identify where reliability engineering effort should be concentrated.
Alerts by Severity and Urgency
Severity analysis highlights whether alerts are classified appropriately. When too many events are labeled critical, responders lose the ability to prioritize. Healthy teams use clear severity definitions, predictable escalation paths, and regular calibration reviews to maintain consistency during incidents.
Alerts by Time of Day or Week
Understanding when alerts occur is just as important as understanding how often. Patterns such as alerts firing immediately after deploys, heavy off-hours activity, or predictable seasonal spikes help leaders adjust staffing, rotations, and deployment practices.
Alerts by Responder or Team
This view shows how on call workload is distributed across individuals and teams. Uneven distribution leads to burnout, slower acknowledgment, and low morale. Balanced workload is essential for sustainable on call operations and long term engineering health.
Human Centric Metrics That Measure Workload Fatigue and Burnout

Modern SRE practices place equal importance on system reliability and the well-being of the people who maintain that reliability. Human-centric metrics help teams understand when on-call duties are becoming unsustainable and where support is needed most.
1. Interruptions per On Call Shift
This metric captures how often responders are pulled away from normal work. Frequent interruptions reduce productivity, increase stress, and make it difficult for engineers to stay focused even during standard working hours.
2. After Hours Page Distribution
A high percentage of alerts occurring late at night or early in the morning usually indicates structural issues within the system. When most pages arrive during off hours, the burden on responders becomes unfair and the rotation requires rebalancing or deeper service improvements.
3. Recovery Hours
Recovery time reflects how long it takes for a responder to regain full productivity after handling an incident. Lengthy recovery periods often signal overly disruptive alerts or emotionally demanding incidents that drain energy and attention.
4. Burnout Indicators
Burnout becomes visible through patterns such as rising MTTA, slower responses during late hours, frequent re escalations, and team members asking to leave the rotation. Tracking these indicators helps leaders intervene early before morale and performance begin to decline.
Process Quality Metrics That Reveal the Efficiency of Incident Response
Strong incident response is measured not only by how quickly issues are resolved but also by how smoothly the process functions from start to finish. Process quality metrics help teams understand where coordination breaks down, where knowledge gaps exist, and where improvements will have the greatest impact.
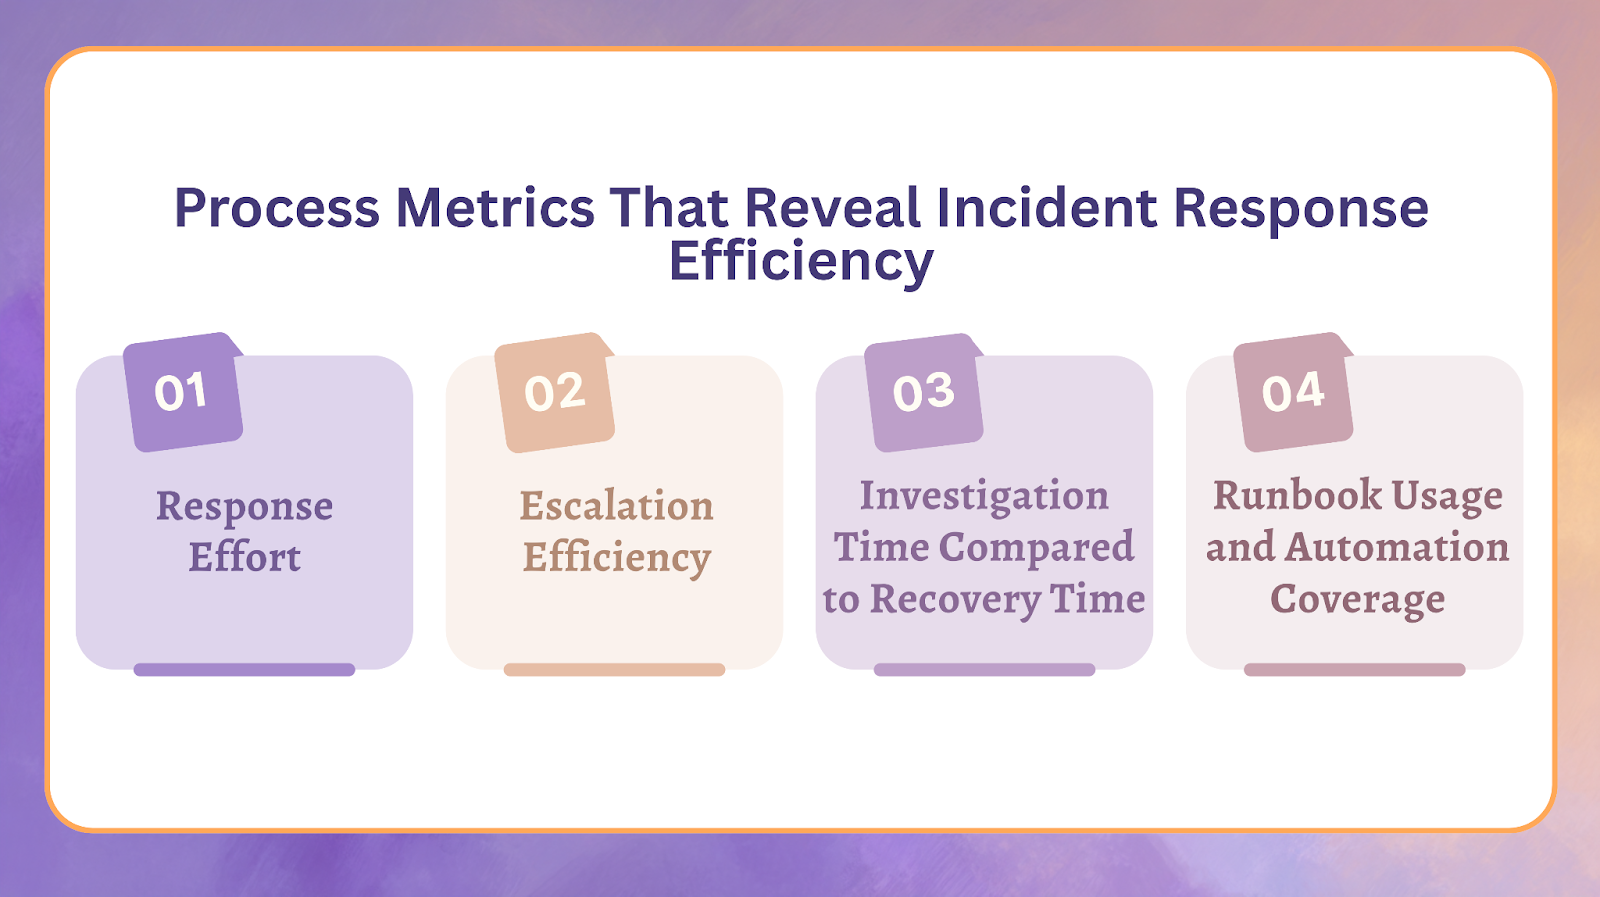
1. Response Effort
Response effort measures the total time between acknowledgment and full resolution. It highlights how much work is required to diagnose the issue, gather information, coordinate with others, and apply a fix. Long response effort times often point to unclear procedures or missing automation.
2. Escalation Efficiency
Escalation efficiency shows whether alerts reach the right owner on the first attempt. If escalations continue to move between teams or individuals, it usually means ownership is unclear or routing rules are outdated. Efficient escalations reduce confusion and shorten overall response time.
3. Investigation Time Compared to Recovery Time
This metric compares the time spent understanding the issue with the time spent applying the fix. When investigation consistently takes longer than the actual repair, it suggests that systems are difficult to reason about or that key runbooks and diagnostic steps are missing.
4. Runbook Usage and Automation Coverage
Runbook usage reflects how often responders rely on documented procedures during incidents. High usage indicates that runbooks are accurate, accessible, and helpful. Low usage often signals outdated instructions, too much tribal knowledge, or a lack of trust in documentation. Automation coverage shows how many routine steps have been converted into reliable automated actions, reducing cognitive load and speeding up response.
Noise Reduction Analytics That Protect Teams from Fatigue
Noise reduction metrics are often overlooked, yet they have the greatest impact on alert fatigue, burnout, and slow incident response. When teams reduce unnecessary noise, they improve both reliability and quality of life for responders.
1. Alert Noise Ratio
Alert noise ratio measures the percentage of alerts that require no action. When this number rises above roughly thirty percent, responders are forced to sift through signals that add no value. High noise ratios indicate broken thresholds, redundant alerts, or outdated monitoring logic.
2. Repeated Alerts
Repeated alerts reveal deeper systemic issues. They often come from services with recurring problems, thresholds that are too sensitive, or monitoring rules that were never tuned. Identifying and addressing these patterns significantly reduces unnecessary interruptions.
3. False Positives and Flapping Alerts
False positives and alerts that repeatedly toggle between healthy and unhealthy states undermine trust in the paging system. When responders stop believing alerts, acknowledgment slows and real incidents are harder to distinguish. Continuous monitoring of signal quality is essential for maintaining confidence in on call operations.
Reliability and Business Impact Metrics That Connect Engineering Work to Real Outcomes
Reliability metrics do more than describe system behavior. They show how engineering performance affects customers, revenue, and long term business health. These measurements help teams demonstrate the value of operational excellence and justify investments in tooling, staffing, and process improvements.
1. SLA and SLO Compliance
Service level agreements and service level objectives define the availability and performance commitments made to customers. On call metrics feed directly into these commitments by showing how quickly incidents are acknowledged, how long outages last, and how consistently uptime targets are met. Strong compliance reflects stable systems and mature operational practices.
2. Customer Impact Score
Not every alert affects end users, but the ones that do carry significantly more weight. A customer impact score highlights which incidents caused visible disruption, degraded experience, or financial loss. Tracking this metric helps teams prioritize fixes based on real user outcomes rather than internal severity labels alone.
3. Change Failure Rate
Change failure rate shows how often deployments or configuration changes result in an incident or require a rollback. By connecting on call activity with recent changes, teams can identify risky release patterns, unstable components, or weaknesses in testing. This metric directly bridges reliability engineering with development practices.
4. Cost of Downtime
Downtime carries a measurable financial impact through revenue loss, productivity loss, and customer churn. Estimating the cost of each incident provides a clear business case for improving reliability. When leaders understand the true cost of interruptions, investments in better tooling, staffing, and operational processes become much easier to justify.
How to Interpret On Call Metrics and Understand the Story Behind the Numbers
Metrics do not only show what happened. They reveal why it happened.
Patterns That Often Reveal Deeper Issues
1. High MTTR with only a few alerts
This usually means responders do not have enough knowledge or documentation to troubleshoot efficiently. When the team spends a long time fixing a small number of issues, it often points to missing runbooks, unclear steps, or systems that are difficult to reason about.
2. Escalations that pass through multiple people
When an alert moves from one responder to another several times, the ownership path is unclear. This often means routing rules are outdated or the service does not have a clearly defined owner.
3. Slow acknowledgment during late night hours
A consistent drop in MTTA after midnight usually indicates a rotation imbalance. Responders may be carrying too many after hours pages or the workload is not fairly distributed across the team.
4. Alerts clustering immediately after deployments
When incidents repeatedly occur right after a release, the issue is often tied to deployment quality. This pattern suggests release validation is weak, testing is incomplete, or the deployment process itself introduces instability.
Creating a High Impact On Call Metrics Strategy
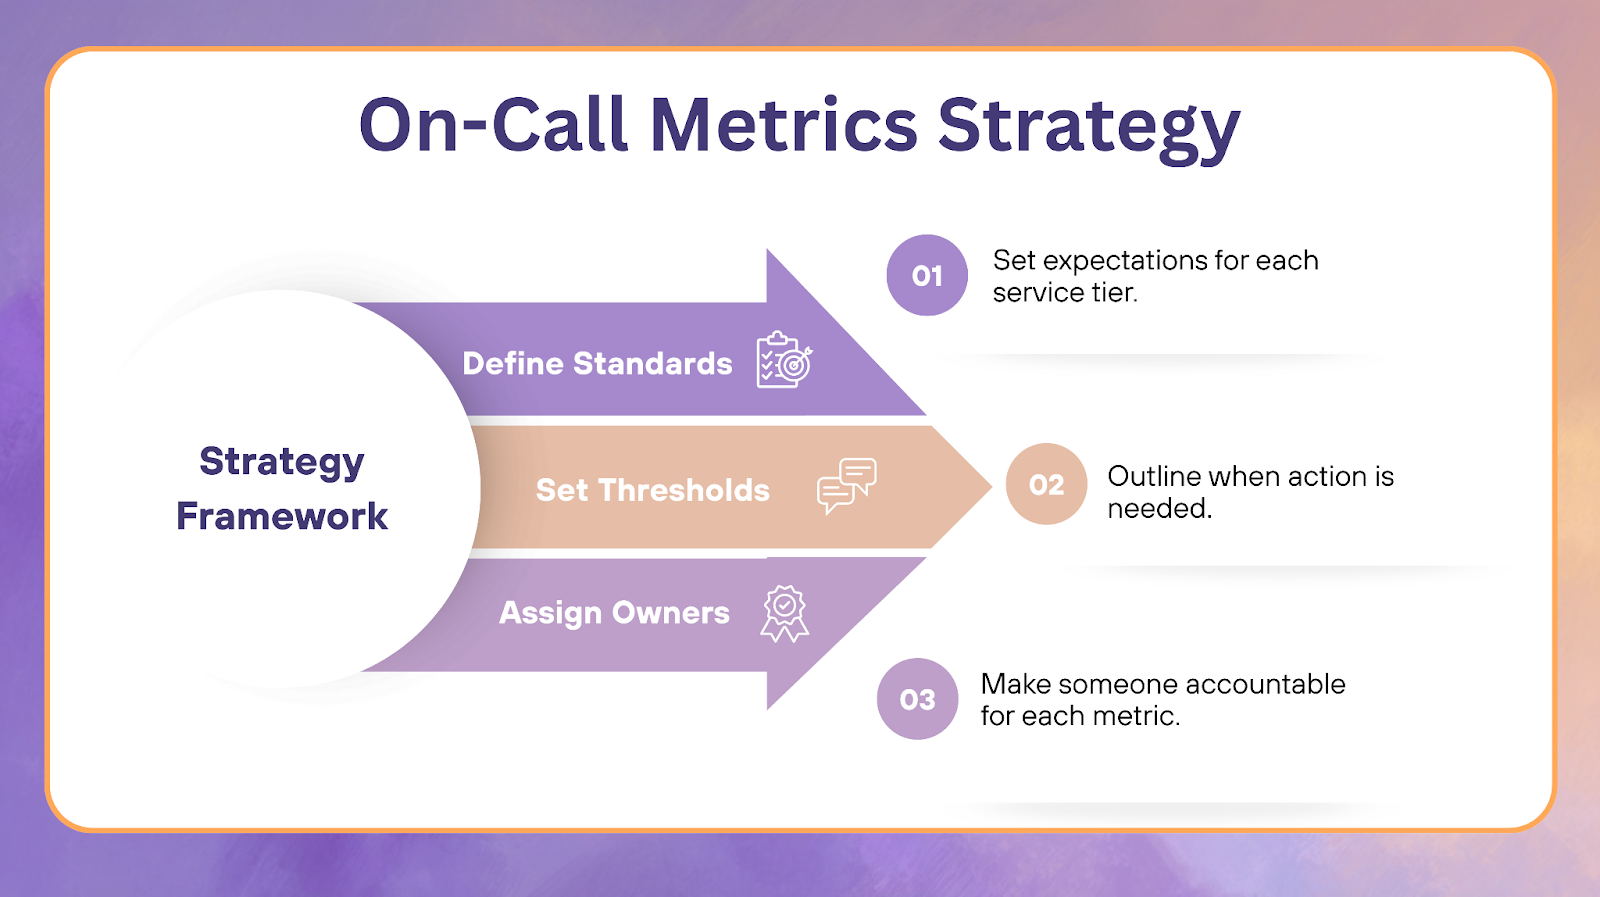
A strong on call strategy begins with clarity. Teams improve fastest when expectations are defined, targets are realistic, and ownership is distributed across the organization.
1. Define What Good Looks Like for Each Service Tier
Different systems play different roles. A critical customer facing service cannot be held to the same response expectations as a background batch processor. Establishing clear definitions of acceptable MTTA, MTTR, and alert volume per service tier gives responders practical guidance and prevents unrealistic performance standards.
2. Set Clear Thresholds
Metrics have value only when they support real outcomes. Thresholds should be tied to reliability goals and customer commitments rather than vanity targets. Clear thresholds help teams recognize when attention is needed and prevent confusion during high pressure incidents.
3. Assign Ownership
Every metric should have a responsible owner. When someone is accountable for monitoring a metric, identifying deviations, and driving improvements, progress becomes measurable and consistent. Ownership also ensures that no critical signal goes unnoticed.
Dashboards and Tooling That Turn Metrics Into Action
High quality dashboards make on call data meaningful. They highlight trends, reveal weak points, and guide decisions during incidents and reviews.
1. Unified On Call Data Pipeline
A connected data pipeline brings together information from alerts, incidents, and escalation records. With all sources combined, teams can see:
- The full lifecycle of each issue
- How alerts lead to incidents
- How escalations affect response time
2. Real Time Dashboards
Effective dashboards focus on patterns rather than raw numbers. Helpful visualizations include:
- Time based graphs that reveal changes over hours or days
- Heat maps that highlight recurring problem areas
- Trend lines that show improving or worsening performance
3. Stakeholder Views
Each audience needs a different level of detail. Dashboards should support:
- SRE teams that require granular diagnostics
- Engineering teams that monitor service health
- Leadership that tracks high level reliability outcomes
4. Automation Opportunities
Modern tooling reduces manual work through automated actions such as:
- Tagging and classifying alerts
- Routing alerts to the correct owner
- Reducing noise through correlation
- Recommending relevant runbooks
Improving Your On-Call Metrics With Practical and High-Impact Fixes
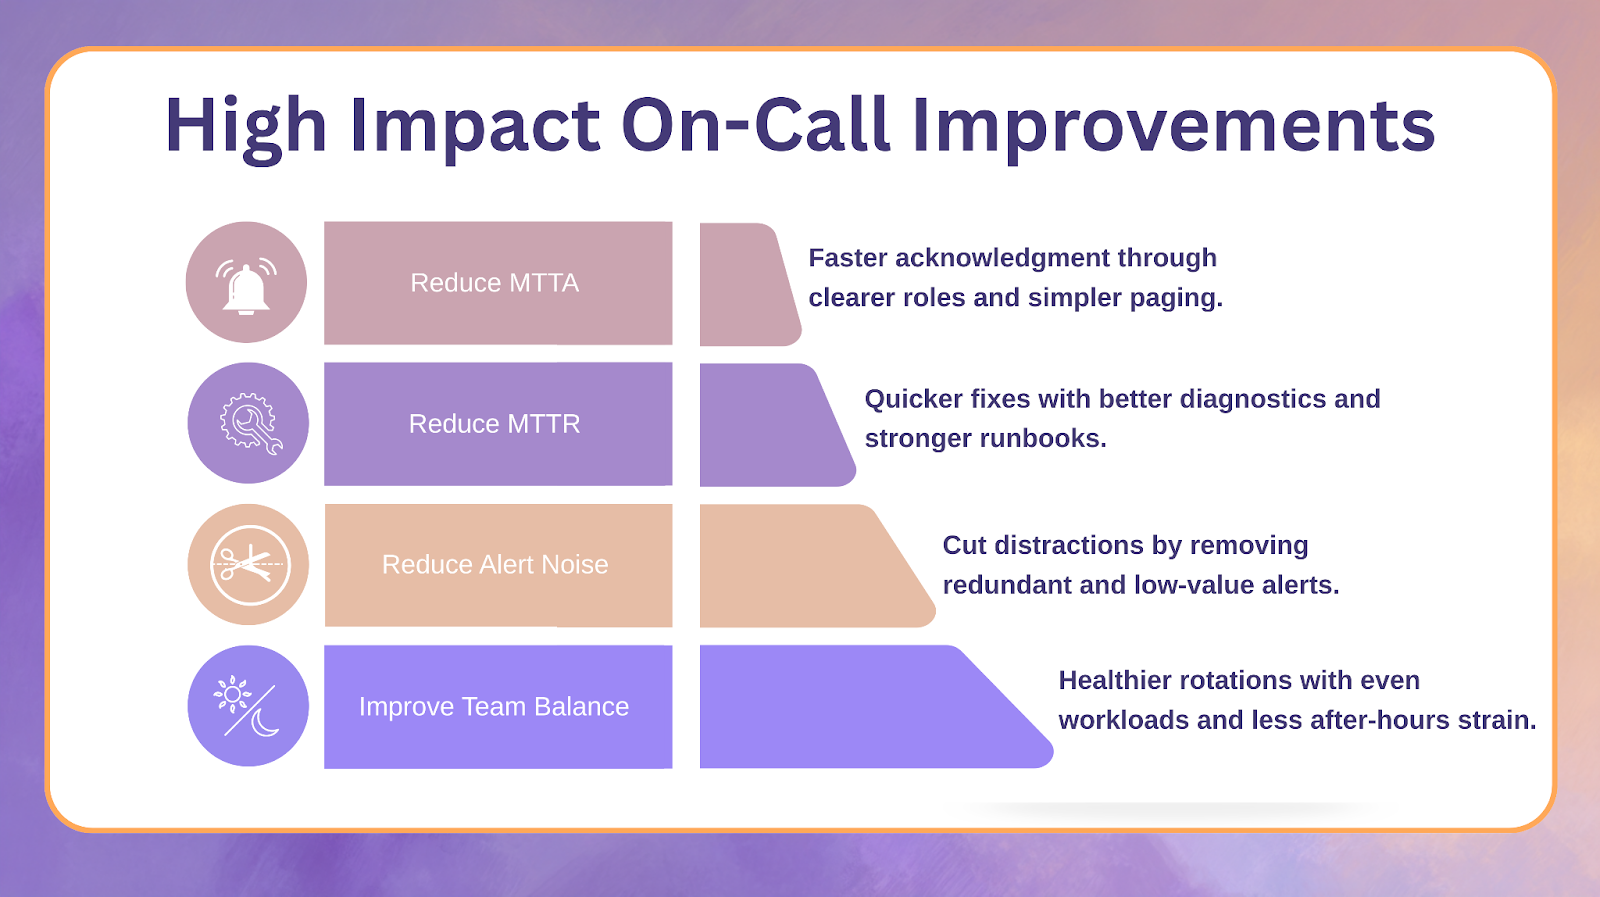
Meaningful improvements come from focused action. These four areas create the biggest gains in performance and team well-being.
1. Reduce MTTA
Faster acknowledgment comes from simpler, more predictable paging. Key improvements include:
- Clearer responder roles
- Fairer rotation schedules
- Lower alert noise
- Mobile-friendly alerting
2. Reduce MTTR
Shorter resolution times require better support for diagnosis and repair. High impact steps include:
- Automated diagnostics
- Reliable and simple rollback paths
- Complete and accurate runbooks
3. Reduce Alert Noise
Removing unnecessary alerts gives responders more focus and less fatigue. Effective techniques include:
- Eliminating redundant signals
- Tuning thresholds
- Refining severity classification
4. Improve Team Balance
A fair rotation protects morale and prevents burnout. Improvements include:
- Distributing workload evenly
- Cross training team members
- Tracking after hours interruptions
How Mature Organizations Operationalize Reliability
High maturity organizations practice reliability continuously, using structured reviews, transparent reporting, and forward looking analysis to stay ahead of incidents rather than react to them.
1. Monthly Reliability Reviews
- Identify incident trends
- Surface recurring bottlenecks
- Understand root causes
These meetings help teams regularly check the health of their systems. By identifying trends, surfacing bottlenecks, and reviewing root causes, teams develop a shared understanding of what is working and what needs improvement. The goal is steady progress, not assigning blame.
This creates a predictable improvement cycle where issues are addressed before they grow.
2. Reliability Scorecards
- Present service stability
- Highlight repeating failures
- Show workload patterns
- Monitor burnout indicators
Scorecards act as a dashboard for organizational health. They present stability metrics, highlight recurring failures, show how the workload is distributed, and reveal early signs of burnout. This single view makes it easier for leaders to understand the overall state of reliability.
This enables better prioritization and faster decision making across teams.
3. Predictive Analytics
- Forecast service failures
- Identify staffing gaps
- Detect rotation imbalance
- Estimate burnout probability
By analyzing historical data, teams can forecast future risks. This includes anticipating service failures, recognizing upcoming staffing shortages, spotting imbalance in rotations, and estimating burnout probability. Predictive analysis shifts reliability from reactive to proactive.
This allows organizations to fix problems before they impact customers.
Common Mistakes to Avoid When Tracking On Call Metrics
Many teams collect metrics without a clear purpose. Tracking everything without meaning creates noise rather than clarity. Another common mistake is optimizing MTTR before addressing alert noise, which often leads to shallow improvements that do not last.
Ignoring responder fatigue is equally harmful. Rising stress levels eventually show up in slow acknowledgment times, poor decision making, and high turnover. Miscalibrated severity levels, inconsistent escalation paths, and outdated routing rules also degrade trust in the on call system.
Finally, reliability should never be viewed as an individual responsibility. It is a system level effort that requires collaboration, shared ownership, and continuous refinement. Data should empower teams to improve, not punish them for occasional mistakes.
Strengthening Reliability Through Better Metrics
Effective on call operations depend on more than quick responses or well configured alerts. They require clarity into how teams behave under pressure, how systems fail in real conditions, and how processes either support or slow down incident response. When engineering teams measure the right signals, they gain the visibility needed to strengthen reliability, reduce unnecessary workload, and protect the people who keep everything running.
With a thoughtful approach to analytics, organizations move from reacting to incidents to anticipating them. Trends become easier to spot, decisions become faster, and operational health becomes easier to maintain. Most importantly, engineers feel supported rather than overwhelmed, leadership gains confidence through clear data, and customers benefit from a more resilient experience.
Rootly is built to power this level of operational maturity. We unify alerts, incidents, escalations, and AI driven insights in one place so teams can work with clarity rather than chaos. With Rootly, responders gain the visibility and automation they need to run a healthier, more predictable on call program.
When teams pair strong metrics with a platform designed for modern reliability, the result is an on call practice that improves continuously and supports long term organizational success. We make it easier for engineering leaders to reduce noise, speed up response, and support their teams without adding more overhead.
If you want to see how we can help you strengthen reliability and create a calmer on call experience, book a demo and experience Rootly in action.
FAQ
1. What are the most important on call metrics to track?
The core on call metrics to monitor are MTTA, MTTR, alert volume, paging frequency, and escalation rates. These measurements show how quickly responders act, how effectively issues are resolved, and whether the overall workload is healthy for the team.
2. How do you reduce on call fatigue?
On call fatigue improves when unnecessary alerts are removed, rotations are balanced fairly, and recurring service problems are addressed at the root. Reducing noise, improving documentation, and automating routine steps also lighten the load on responders.
3. What is a good MTTR?
A good MTTR depends on the importance of the service. Critical user facing systems require fast recovery times, while noncritical background jobs can allow for longer resolution windows. What matters most is consistency. Stable MTTR trends signal mature processes and a predictable incident response practice.
4. How do you measure on call workload?
On call workload is measured by tracking alert frequency, after hours pages, interruptions per shift, and escalation volume. These signals show how often responders are disrupted and whether the rotation is evenly balanced across the team.