

.avif)


In cybersecurity, incidents are inevitable, and the difference between stumbling under pressure and rising above it comes down to preparation. Incident response metrics provide that preparation by turning downtime, customer trust, and compliance risks into measurable outcomes. They are more than numbers on a dashboard; they tell the story of how quickly and effectively a team can detect, respond, and recover, making resilience tangible rather than abstract.
ChatGPT said:
Key Takeaways
- Incident response metrics track detection, response, and recovery to show how prepared teams are for real-world threats.
- MTTD, MTTA, and MTTR reveal speed and efficiency in identifying, acknowledging, and resolving incidents.
- Reliability metrics like MTBF and MTTF highlight system stability and help plan maintenance or replacements.
- SLA compliance and uptime metrics demonstrate accountability to customers and leadership.
- Operational measures such as incident volume and cost per ticket provide insights into efficiency and resource use.
Understanding Incident Response Metrics
Incident response metrics are measurable indicators of how well an organization detects, responds, contains, and recovers from incidents. They turn chaos into accountability and reveal both strengths and weaknesses.
- Metrics: raw measures like detection time.
- KPIs: show whether those measures meet performance goals.
- SLAs: contractual promises on availability or response.
When combined, they offer a layered view of maturity. These insights are valuable beyond technical teams, giving executives, compliance officers, and even customer support a clear picture of risk and performance.
Categories of Incident Response Metrics
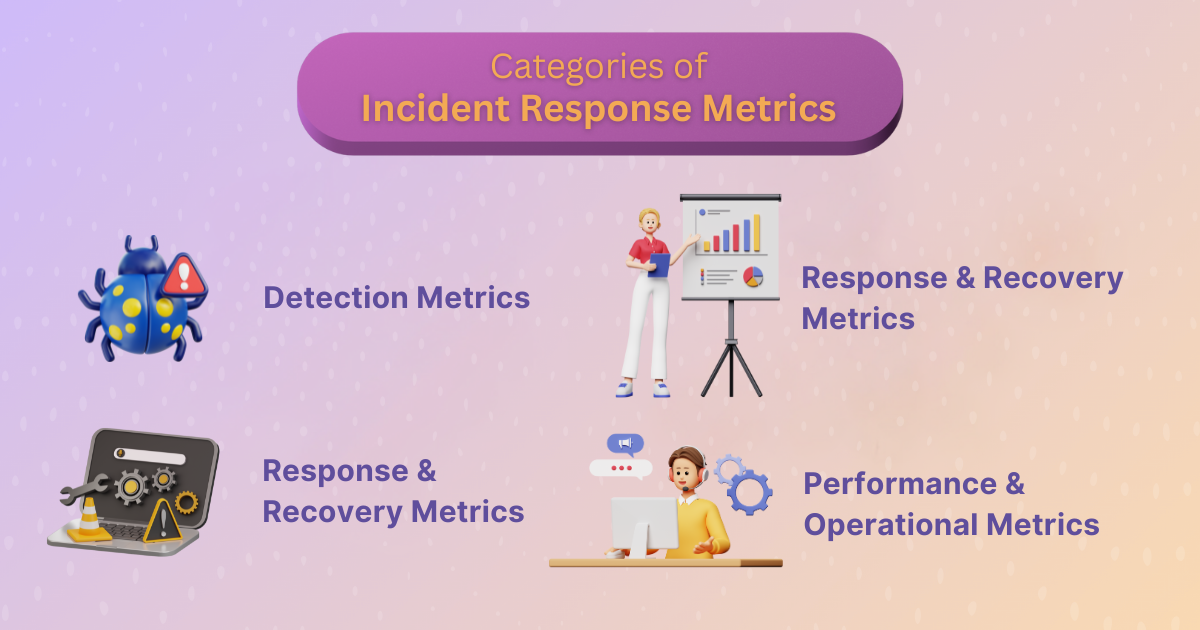
Detection Metrics
- Mean Time to Detect (MTTD): Measures the average time between when an incident occurs and when it is identified.
- Mean Time to Acknowledge (MTTA): Tracks the gap between when an alert fires and when a human begins working on it.
- Mean Time to Inventory (MTTI): Measures how quickly new assets are identified and logged in systems to reduce blind spots.
Response & Recovery Metrics
- Mean Time to Respond (MTTR): Can represent respond, repair, recover, or resolve. Each interpretation measures different parts of the response lifecycle.
- Mean Time to Contain (MTTC): Calculates how long it takes to prevent further damage after detection.
- Mean Time to Recovery (MTTR as restore): Focuses on how quickly systems return to full functionality.
- Mean Time to Repair (MTTR as fix/test): Tracks how quickly fixes are applied and validated.
- Mean Time to Resolve (MTTR as permanent solution): Goes beyond the fix to include implementing measures that prevent recurrence.
Reliability & Availability Metrics
- Mean Time Between Failures (MTBF): Evaluates system reliability by tracking time between breakdowns.
- Mean Time to Failure (MTTF): Applies to non-repairable systems and shows expected lifespan before total failure.
- System Availability / Uptime: Expressed as a percentage of time systems are operational.
- SLA Compliance: Tracks how well vendors or internal teams are meeting contractual uptime and recovery promises.
Performance & Operational Metrics
- Incident Volume and Frequency: Shows how many incidents occur in a given time frame.
- Incident Severity Levels: Categorizes impact and helps prioritize resource allocation.
- Average Response Time: Evaluates how quickly incidents are routed to the right responders.
- Escalation Rate: Tracks how often incidents are passed up the chain.
- First-Touch Resolution Rate: Shows how many issues are resolved without repeat alerts.
- On-Call Time / Team Fatigue: Highlights workload distribution and burnout risk.
- Incident Report Time: Tracks when incidents are documented, providing trends over time.
- Cost Per Ticket: Provides insight into operational efficiency and ROI of security spending.
Deep Dive Into Key Metrics
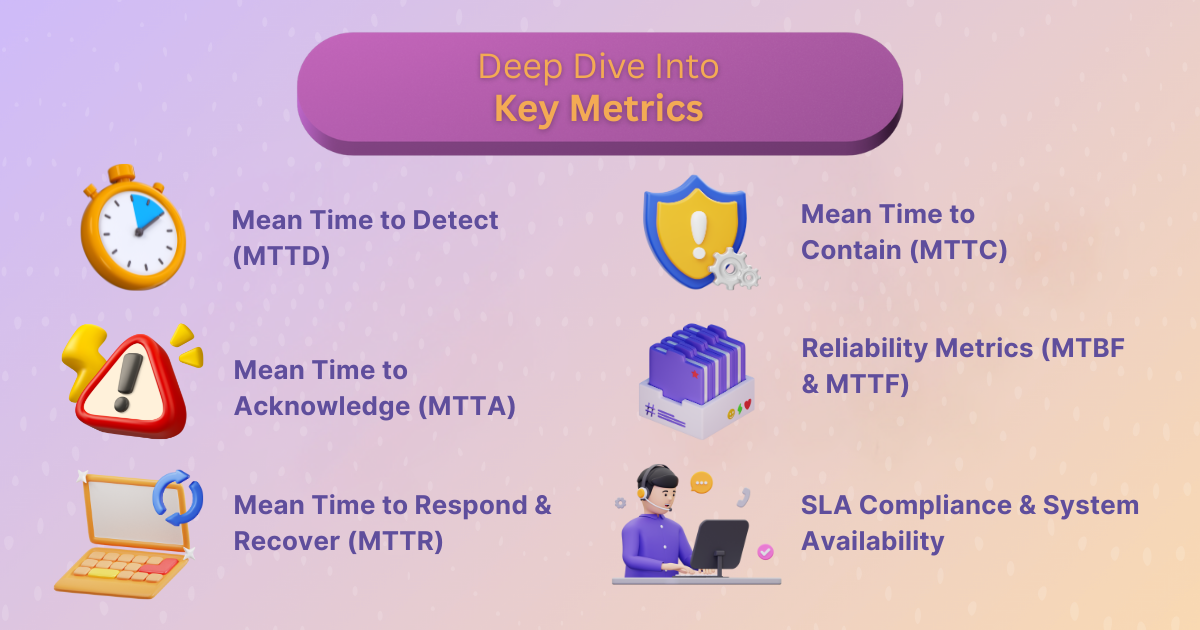
Mean Time to Detect (MTTD)
Detection speed is the difference between catching a burglar at the window and realizing days later that valuables are missing. MTTD calculates the average time to identify incidents, offering a snapshot of visibility. Lowering MTTD reduces attacker dwell time, limiting damage and cost.
Improvement strategies include automated anomaly detection, behavioral monitoring, and tuning SIEM tools to reduce false positives. Industry leaders often benchmark phishing detection to under an hour, but organizations should set goals that reflect their maturity and tooling.
Mean Time to Acknowledge (MTTA)
An alert unacknowledged is an incident unmanaged. MTTA measures the time between an alert and a human response. Slow acknowledgment often reflects alert fatigue, staffing gaps, or poor prioritization.
Practical improvements include rotating on-call schedules, setting clear severity tiers, and using automation to triage routine alerts. Reducing MTTA shows customers and stakeholders that the organization is attentive and responsive, even before a fix is in place.
Mean Time to Respond & Recover (MTTR)
MTTR has multiple interpretations, from responding to fixing to recovering. This ambiguity can lead to confusion, but when clearly defined, MTTR is invaluable. It reveals not just how fast issues are fixed but also how sustainable the fixes are.
In industries like healthcare or e-commerce, every minute matters. A hospital system might track MTTR in seconds, while a SaaS provider may focus on ensuring fixes don’t reintroduce vulnerabilities. Teams can diagnose bottlenecks by examining where delays cluster: in detection, diagnostics, repair, or validation.
Mean Time to Contain (MTTC)
Containment reflects the team’s ability to stop the bleeding. MTTC brings together detection, acknowledgment, and resolution, offering a holistic picture of incident management. A ransomware outbreak that spreads across endpoints exposes high MTTC, while swift isolation of a single compromised laptop reflects a low MTTC.
Benchmarks vary, but proactive measures such as endpoint isolation tools, pre-approved playbooks, and network segmentation dramatically reduce MTTC.
Reliability Metrics (MTBF & MTTF)
Reliability is about prevention as much as recovery. MTBF measures time between failures in repairable systems, while MTTF covers non-repairable systems. These metrics originated in aviation, where failures meant loss of life. In modern IT, they guide lifecycle planning and vendor selection.
Organizations with low MTBF may face recurring outages that erode trust. By tracking both MTBF and MTTF, leaders can decide when to patch, when to replace, and when to retire systems.
SLA Compliance & System Availability
Availability percentages matter because customers notice. A service that promises 99.99 percent uptime but delivers 99.9 percent creates over 40 extra minutes of downtime each month. SLA compliance ensures vendors are accountable, and it provides leverage when renegotiating contracts.
Monitoring availability also uncovers hidden dependencies. A cloud provider’s outage can ripple through multiple systems, reminding organizations that vendor resilience is as critical as internal preparedness.
Supporting Metrics That Improve Incident Response
Incident Volume & Severity
Tracking frequency alone is not enough. Severity adds context, showing whether the team is putting out brushfires or fighting five-alarm blazes. Patterns in volume and severity reveal chronic weak points, such as misconfigured APIs or recurring insider threats.
Escalation Rate
Constant escalation suggests skill gaps or poor initial routing. Improving classification and empowering first-line responders reduces the need for handoffs, accelerating resolution.
First-Touch Resolution Rate
A high first-touch rate signals maturity. It reflects strong documentation, clear playbooks, and well-trained staff. Balancing speed with accuracy prevents premature closures that lead to repeat incidents.
Cost Per Ticket
Security is often seen as a cost center. Cost per ticket reframes it as an investment by showing the efficiency of resources. Automation and smarter tooling reduce per-ticket costs, freeing budget for proactive security measures.
How to Use Incident Response Metrics Effectively
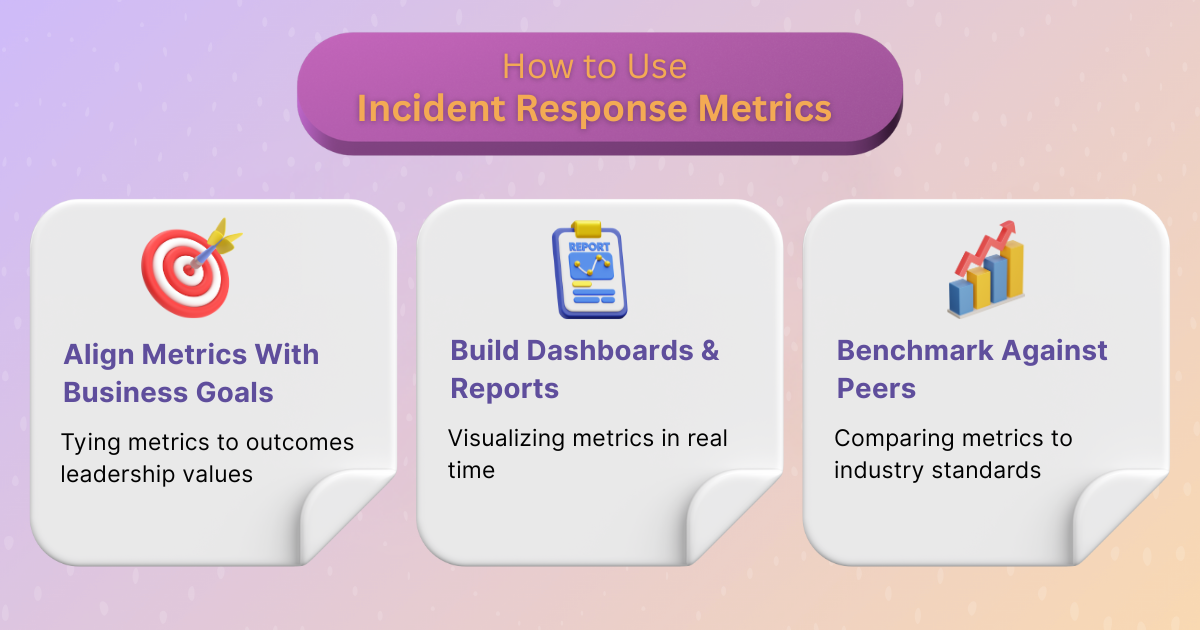
Aligning Metrics With Business Goals
Metrics gain power when tied to outcomes leadership cares about. Faster detection reduces financial losses, improved MTTR keeps customer-facing apps online, and SLA compliance avoids penalties. Aligning metrics with compliance standards such as ISO, NIST, GDPR, and SOC2 adds further weight.
Building Dashboards & Reports
Metrics lose value when hidden in spreadsheets. Dashboards bring them to life, offering real-time visibility for both engineers and executives. Tools like Splunk, SecurityScorecard, Jira, and PagerDuty transform data into stories that drive action. Real-world dashboards often include a mix of technical KPIs and business-facing outcomes.
Benchmarking and Industry Standards
Knowing where you stand matters. Benchmarks provide context. For example, an MTTD under one hour for phishing is competitive in many industries. Peer comparisons highlight gaps, while sector-specific baselines prevent unrealistic expectations.
Common Challenges in Measuring Metrics
- Hybrid visibility challenges: Cloud assets, remote endpoints, and third-party vendors all create blind spots.
- Alert fatigue: Too many signals can bury the most critical ones.
- Inconsistent definitions: Metrics like MTTR can mean different things, causing team misalignment.
- Balance issues: Over-reliance on automation or humans alone exposes weaknesses; harmony between the two is essential.
Best Practices for Improving Incident Response Metrics
- Automate detection and asset inventory to cut blind spots and improve visibility.
- Provide regular training and tabletop exercises so teams stay sharp under pressure.
- Streamline escalation workflows to avoid bottlenecks and reduce delays.
- Leverage AI and machine learning for predictive insights and faster anomaly detection.
- Conduct thorough post-mortems after every incident to embed continuous improvement.
Building Cybersecurity Maturity Through Metrics
Metrics are not just about numbers. They are about accountability, trust, and resilience. They provide the evidence leaders need to secure budgets, the clarity teams need to improve, and the assurance customers need to stay loyal. A strong incident response metrics program transforms chaos into confidence.
When we commit to tracking, analyzing, and improving on these measurements, we are not just reacting faster. We are building organizations that can withstand disruption and emerge stronger. That is the true value of incident response metrics, and the future of resilient cybersecurity. At Rootly, we provide the tools to capture incident metrics and transform them into meaningful actions that help teams build resilience over time.